| FAQs |
|
Q. How does this system works?
When given a single sequence or a set of sequences and the genetic system, this servers finds the positions of hidden stops in +1 and -1 frames. This server also returns the positions of start codons as well in the same +1 and -1 frames. This system also calculates the correlation between average codon usage frequency and contribution of each hidden stop.
Q. What are the hidden stops?
Hidden stops are the stop codons that might appear in a genetic sequence in +1 or in -1 frame. The frameshifit mutation is a mutation caused by indels, i.e. insertion or deletion of one nucleotide. Such indels could disrupt the frames and may lead to hidden stops.
Q. Why are the hidden stops important to us?
The role of a stop codons is to tell the riobosome when to sotp the translation process. If a stop codon appears at wrong positons, earlier or later than the normal position, it might lead to unusual protein product. Usually such proteins are non-functional, but in some cases though, they may lead to a cascade of diseases like cancer.
Q. Why codon categories in some graphs are different even for the same genetic system?
Codon categories in the graph will depend on the sequence compositions. This is because, it might be possible that the codons that contribute for a particular category are absent in the 0th frame in that particular sequence and hence in that case, the garph will not show that particular category.
Q. How the correlation is calculated?
The correlation is calclulated between the average codon usage frequency and the codon categories. The average codon usage frequency depends on the average frequency of each codon, for a particular category, in 0th frame in the given sequence.
Q. What are the codon categories?
Codon category is the number that how many differnt stop codons a codon could code in +1 and in -1 frames. For example, in the standard genetic system, AAA will code for 3 stop codons in +1 frame, whereas AAC will code for 2 stop codons in +1 and 1 stop codon in -1 frame, with a total of 3 and hence they will come under the category of 3. AGT will code for 2 stop codons in +1 frame and 4 stop codson in -1 frame and will fall under category 6.
|
|
| |
| Help |
|
|
| |
| 1. Fasta Format |
|
| This is an example of Fasta Format. The sbumission to this server should be in this format only, whereas the mode could be pasting the sequences directly or uploading a sequence file in fasta format. A sequence in FASTA format (a.k.a. Pearson format) begins with a single-line description, followed by lines of sequence data. The description line is distinguished from the sequence data by a greater-than (">") symbol in the first column. It is recommended that all lines of text be shorter than 80 characters in length. An example sequence in FASTA format is: |
>fasta_header
sequence......(this part should contain only [atgcu | ATGCU]
sequence......
sequence......
sequence...... |
| |
>ref|NC_012518|66-656
GTGTGTGATTTAAGAAAAACAAAACTAATAGATAAAATAAGTTCACTAGAACTATACAAATACTCAATAT
TTTTTAGAAATTACATTGAAAATGTAGCAGAAGATTGTCTCAAGAACGGACTTATTCTTGAGAGTGCTGC
CCACAATGTTAGTGAGGTTGAACTTGCTAGGTTAAAGGTACAGCTTAAGAATGCTCTGCTTAATTGTATT
ATAAGCTACCGTTTTCATGGGATTGGCTATGTTTTAGTAAAAACCAAAGATACCCTAATGGATCTAGAAC
AACCCGTTAATATAGAATTACCTATTGGTTTTGAATACCTTGATTATGAATATGTAAGAGATTTGGGAGT
TGATTTTGATCATATAACCTATAAAGTAAAATCCAACAATAAGAACAATTCTTTAGATGCAGTTAAAATA
CATAAAAGTCGACTTATCATATACGAAAACTTTGATTATATCTTAAAAAGATATGTTCCGTGTTATACCG
AAAGCTTTTTACTAGATATTTATTTATTTGAAAAGATATACGTAGAAATAGAAAGACGTATTGAAAACCA
CAATTTTTGTTTTACAAAGATGAATCTTTAG
>ref|NC_012518|632-1288
TTGTTTTACAAAGATGAATCTTTAGTACAACTACAAGACGCACTTTCTAGTGCAACAACTTCTTTAAGTG
CACTTACTCAGAGCAATAATGATAGGGGAAGTGGCATTTTATCTTCTTTTTTGAGAAAACAAAATTCAAA
CAATCATAGTAAAGATATTTCTAATTTAAGAAACCTTAATGACTCATTGTCACAGGAGCTTGCCAGGCTA
AAAAGCAATCTAAATAATGAGGGAATGTTTTATACAGCTACTCCTAGTGCTAGTTTAGAGGTTATTAAAT
ACGATCTTAGTTACTTAAAGGAGGCTTTAGCATTAATTAAGGCAAAAATTGGTGCAGATACTAAAGAGCC
CTTAACCAGAAGTTTTAATGAACAGGCTAAAGGACTGGGAAATGATGGTAAAGGTGATAGGAGTAATTAT
TACGATTTTCTCAAAGGTGTACAAGAACAAGTTGAGAACTCTTGTAATTTAAAACTTACAAAGTATTTTG
GACTTGATATGAAGTTTAATTCGCTGATTATGTTAAGTGAAGAACAAAAAGTAGAAAGAGATATAAAGCT
AATTGAGCTTTACAGTAAATATAACCAGCTTATACAAAGTAGCTCATTTAATAATGAGGAGCTAGCGATG
TTAAAAGAGAAATTATTCTCATTTTGA
>ref|NC_012518|1305-2009
ATGACTGAGAAAGAAGAAAAAGAAGACCTGCAGGCACAAGATAAAGAAGAGCAGCAAATTAAGGCTGATA
CTAAAGTTATCAGTGTGCAGGAATTTGAAGAGTACATGCGTTTTAAAGAGCAGGCAAATAGTAAATCTAA
AGAGACAAGTCGAGATTTAAGTATAAATGAACGAATAACAAAAGAACTTGCAGAAGTTGAAGAGCGGGAG
CGTATTGAAAAGCAATTGTTACTAGAGGCTGAGCGAATTAATGAAATTGATACACTTGCAAAAGCACATC
TTAGCAATCATTTTAACAAAGAGGTGCTACTTGCAAAAGGATATACATTAAAAGACATTATGCAAGCACA
ACGTAGAGAACTTGTACGCAAGTTCGTTCCAATTGAGCAAATTAAAGCTATTGCCAAAGTATCAGACATA
AGTCATATCGATGGAGAGATATTAGAGCAACTTGTTTCTTTAGCAAAAGTGAATATTAAATTAAGAAAAA
ATGCGAGTAGCAGTTCTTCTTCTGTTGACTCTATTAAGGGGAATATTGCTATTAAATCAGAAGAAAGAGC
AAGTTTGCTTGATTCTAATTTTGTACCTATTAATTTCACAGAATTTGTACAAGCGATAAGTAATACATAC
AAGCAAAGACGAATTCAATTTTATGAAAATCTAAAAAGACATAAAAGAACAAGTATTGCCCAAAGGAGTT
TTTAA
>ref|NC_012518|2010-2567
ATGAGTGATATAACAAAAATTAAACAAGAATTTGATAAGAAAGTTGCAGAAATTCAAGCATTAATGAAAA
ATCCCCAACAAGACTCAGGATTGCTTAGCAATTCTATTGATTTTAGAGACCAAAATCTAATTTTTTCCAA
TTCTGGTGGGGTTTGCACTAGCAGTAAAGACAAAATAGAGAATTACCCTGCTAAAGGGTATCCGTATAAA
CGGGGTGTTAAGCTTAGTTTTGGAGATGGAACAACCGAACTAGAAGTTGAGGCTGGTGGTGGAGACGATT
TATATGGAGTGTGTTCCGATATAGATGAGTTTAGCGGTATGGCAACTGTTATACCAATTACAAATAACTT
TACAGGATATTTAACGCTAAAGAAAGATGGACAAAATAGTGTAAATCCAGGAGATAAACTGAACTTTAAC
CAACATGGAGAACTTGAAAAGGCCACTGGGGGTCAAAAGACCGTCAATGCGATAGCACTTTCAAAAGCAC
ACAAATTAACCGAAGAATTATTTATAGTGCTTGCTAGTGTATTTGGGAATAGAGCAATAAAAGGGTAA
>ref|NC_012518|2574-3338
ATGGCTTTAAAAGGCAACGTGCAAGTAGAAAATCTTGAGGCTGTTGAGGACCCACAGGTAGATTTAGGGG
CACAAGTTCCCGCTGCTCCTAGAGCTAAACGGCAAGCAAGACAAGCTGAGGATGCACAAGGGGAAGATTC
CTATTTGGAGGCAATTAACGAGCTTGATGATGTCCTTTTGAAATTCAAGAAATATGTAAAATCGATGAGT
TCAATTGAAAATAAGGTTTTTGGCGGTTTAAGTAGTTGTTTTAAATCTAAGAATGAGCGAGTTGATGCAT
ATTCATTTGCATGTTCAAGTTATACAGACAAAATAGAGGAATACCTTTACGACCCAGCAAATAGTTTTCC
ATACAAGCGTGGGGTTAAACTTGTTCCAAAAGAGAACTCTATATATGTAGAAGTTGGAGCTGATACTGAT
ATGTATGGGATATGTGTAGATGTATGTGAGTTTAGTTGTACCGCGTATGTATTGCCAATTACTAACAATT
TTGAAGGGTACCTTGTCACAAGGAATCCAAGTATAAAAATAGGAGAAATCCTAGACATAAATAATAACGG
TGTTATTATCAAGGCTGGAGGTGGGCCACCAACCGCAATTAACATATATGCTCTATCTGATTCATTTACA
ATCAATTTTGCACCCGAAGATGGAAATCAAGATCAAAATAGATATCCTAGGCAAGAGTATTCTATTAATT
TGATAAAAGTTGCAATTTTTGGAAATAGAGGCCTTGAGAAGATAGTAATACCTGATGGTGGTTAA
Entire sample sequence file can be downloaded from here (Right click and choose "Save As..." to download this file.). |
 |
| |
|
| 2. GI_Accession ids |
|
GI (GenBank) - A GI or "GenInfo Identifier" is a sequence identifier that can be assigned to a nucleotide sequence or protein translation. Each GI is a numeric value of one or more digits. The protein translation and the nucleotide sequence contained in the same record will each be assigned different GI numbers. Every time the sequence data for a particular record is changed, its version number increases and it receives a new GI. However, while each new version number is based upon the previous version number, a new GI for an altered sequence may be completely different from the previous GI. For example, in the GenBank record M12345, the original GI might be 7654321, but after a change in the sequence is submitted, the new GI for the changed sequence could be 10529376. Individuals can search for nucleotide sequences and protein translations by GI using the UID search field in the NCBI sequence databases. Use NCBI's Sequence Revision History page to view the different gi numbers, version numbers, or update dates associated with a particular GenBank record.
GI number (sometimes written in lower case, "gi") is simply a series of digits that are assigned consecutively to each sequence record processed by NCBI. The GI number bears no resemblance to the Accession number of the sequence record
- Nucleotide sequence GI number is shown in the VERSION field of the database record
- Protein sequence GI number is shown in the CDS/db_xref field of a nucleotide database record, and the VERSION field of a protein database record
For more informatin on this topic, please visit here.
Its suggested to enter the gi numbers is the following fashion (one GI in a line) |
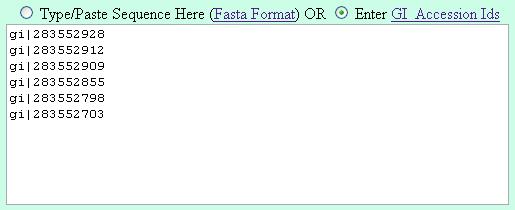 |
| Method 1 |
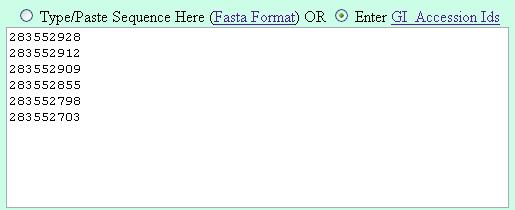 |
| Method 2 |
|
|
|
| |
| 3. Genetic system ? |
|
The genetic code is the set of rules by which information encoded in genetic material (DNA or mRNA sequences) is translated into proteins (amino acid sequences) by living cells. The code defines a mapping between tri-nucleotide sequences, called codons, and amino acids. With some exceptions,a triplet codon in a nucleic acid sequence usually specifies a single amino acid. Because the vast majority of genes are encoded with exactly the same code, this particular code is often referred to as the canonical or standard genetic code, or simply the genetic code, though in fact there are many variant codes. Thus the canonical genetic code is not universal. In humans, for example, protein synthesis in mitochondria relies on a genetic code that varies from the standard genetic code.
The following genetic systems have been incorporated in the study:
|
|
|
| |
| 4. Half-gene analysis ? |
|
Ambush hypothesis implies, if the reading frame of the ribosome is not zero; the earlier a stop terminates translation, the earlier mRNA and ribosomes are available for interacting correctly and it will also help in the reduction of off-frame noise. Variation in gene expression levels or noise strength shows a strong positive correlation with translational efficiency (Gheysan et al, 1982; Ozbudak et al, 2002). There are several experimental evidences of independent regulation of transcriptional units and all experiments are indicative of manipulations towards 5 end of coding sequences.
We have implemented half gene analysis to observe such effects towards 5 end of the coding sequences i.e. to identify the favorable positions or locations of hidden stops in coding sequences. If ambush hypothesis is correct then more hidden stops should be in 5 portion of the gene, as costs of off-frame translation are presumably higher when frame-shifts occur near 5 end of coding genes. We tested this aspect on primates and vertebrates mt coding sequences and found positive evidences supporting this putative event. |
|
|
| |
| 5. Off-frame Stop Codons Density and Ribosomal Secondary Structure Stability ? |
|
According to ambush hypothesis, early termination of off frame transcription should increase the efficiency of expression of a gene, because less time and resources are invested in unproductive off frame contexts. If the reading frame of the ribosome is not zero, earlier a stop terminates translation; the earlier mRNA and ribosome are available for interaction. If the ambush hypothesis is correct, hidden stops should be more frequent for large and frequently expressed genes, since costs of off-frame translation are likely to increase with gene size and expression levels.
Ambush hypothesis implies that the need for hidden stops increases with the probability of frameshifts. It seems plausible that less stable ribosomes are more likely to frameshift and vice versa. In order to resolve this assumption we performed analysis to predict any correlation between the ribosomal stability, counted as a function of predicted stability or ?G of secondary structure (Lück et al 1996, Zuker et al. 1999). Analysis with various kinds of RNAs can help to elucidate novel trends in ribosomal sequences and their correlations with process of transcription and translation can be identified along with functional relatedness. |
|
|
| |
| 6. GC content and HSC analysis ? |
|
The GC contents of the first, second, and third positions of codons, of tRNAs, of rRNAs and of spacer elements are highly correlated. In fact, the GC content accounts for 98% of the variance in coding sequences and 84% of the variance in GC content in rRNA genes (Muto and Osawa 1987). Therefore we can evaluate the effect of GC content on codon disappearance and codon reassignment (Knight et al 2001). SHIFT calculates correlation between HSC and GC % in all coding sequences to evaluate this parameter and its evolutionary implications. |
|
|
| |
|