Significance Analysis of Microarrays implementation using Matlab
The demonstration proceeds to a standard MatSAM analysis. To see the complete documentation for the functions used in the demo, please refer to the API reference home page.
Contents
1- Global arguments
Defines the names of global variables and sets their values.
global data

fprintf ('Declaring and defining global arguments ...\n\n');
global_args ();
Declaring and defining global arguments ...
2- The data set
Specifies the data set from which the experiments and the observations data are extracted. The data set is expected to be provided as two text files (tabulation separated), the first containing only gene expression data values, the second comprised of gene names/tags. This demo is based on the Platinum Spike data set (Zhu et al, 2010).
exprs_file = 'inputs/gse21344_expressions.txt';
obs_file = 'inputs/gse21344_names.txt';
fprintf ('Reading into raw files ...\n');
sam_input (exprs_file, obs_file);
Reading into raw files ...
	Observations count : 18952
	Experiments count : 18
3- Experiment groups
Sets up the design following which the experiments are divided into classes. The experiments are divided into two groups (or classes). In the dataset here used, there are 18 experiments, the first 9 belong to one class (the control group) while the 9 last ones belong to another class (the treatement group). To specify groups, we use 0s and 1s labels. Thus, the classes design will be the following : 0 0 0 0 0 0 0 0 0 1 1 1 1 1 1 1 1 1.
cl = ones (1, size (data, 2));
k = 1;
l = 9;
cl (k:l) = 0;
disp(cl);
  Columns 1 through 13

     0     0     0     0     0     0     0     0     0     1     1     1     1

  Columns 14 through 18

     1     1     1     1     1
4- The main SAM function
The function gives results related, including but not limited to, the expected & observed D scores, the cut-off helping to find expressed & false called observations, the scores of the statistical test, and the fold changes.
fprintf ('Beginning SAM ...\n\n');
[d, d_bar, vec_false, p_value, q_value, fold_out, s] = sam_func(cl);
Beginning SAM ...

Doing statistical test ...

Deciding which statistical test to apply on the data ...

Computing the genes fold changes ...

Computing the numerators and the denominators of the statistical test ...

Computing the fudge factor, "S0" ...

Computing the D-scores ...

Randomly permuting the experiments ...
Computing the D-bar scores and the P-Values ...

Estimating the prior probability that a gene is differential expressed ...

Warning: All data points with NaN in their value will be ignored.


Computing the q-value for each gene ...
5- Thresholds
Gives the watersheds from which the user will determine how many significant observations to pick up.
fprintf ('Summary of obtained results :\n');
full_results (d, d_bar, vec_false);
Summary of obtained results :
Delta	p0	False	Called	FDR	cutlow	cutup
0.1	0.1	7310.3	13741.0	0.0	-0.7	0.2
0.7	0.1	1514.0	4463.0	0.0	-1.7	1.5
1.3	0.1	8130.9	2464.0	0.2	-2.5	2.4
1.9	0.1	4889.7	1952.0	0.2	-3.1	3.2
2.5	0.1	17238.4	1679.0	0.7	-3.8	3.9
3.1	0.1	2679.2	1468.0	0.1	-4.4	4.6
3.7	0.1	1664.4	1385.0	0.1	-5.0	5.2
4.3	0.1	3852.8	1287.0	0.2	-5.6	5.8
4.9	0.1	0.0	1181.0	0.0	-6.3	6.7
5.4	0.1	5585.4	1133.0	0.3	-6.8	7.1
6.0	0.1	1261.0	1051.0	0.1	-7.4	7.5
6.6	0.1	0.0	889.0	0.0	-8.2	8.2
7.2	0.1	9046.4	785.0	0.8	-8.8	8.8
7.8	0.1	0.0	728.0	0.0	-9.5	9.4
8.4	0.1	5849.6	680.0	0.6	-10.1	10.0
9.0	0.1	7910.0	648.0	0.8	-10.7	10.6
9.6	0.1	0.0	616.0	0.0	-11.3	11.3
10.2	0.1	0.0	585.0	0.0	-12.1	11.9
10.8	0.1	0.0	552.0	0.0	-12.5	12.5
11.4	0.1	6983.7	506.0	1.0	-13.2	13.2
12.0	0.1	2052.7	456.0	0.3	-13.8	13.8
12.6	0.1	2642.6	434.0	0.4	-14.5	14.5
13.2	0.1	5299.1	405.0	0.9	-15.0	15.1
13.8	0.1	6767.2	371.0	1.3	-15.6	15.8
14.4	0.1	645.3	328.0	0.1	-16.2	16.4
15.0	0.1	474.5	298.0	0.1	-16.8	17.1
15.6	0.1	0.0	258.0	0.0	-17.4	17.8
16.1	0.1	8851.8	230.0	2.7	-18.0	18.6
16.7	0.1	1724.1	216.0	0.6	-18.5	19.3
17.3	0.1	9255.7	191.0	3.3	-19.1	20.6
17.9	0.1	1185.9	182.0	0.4	-19.7	21.1
18.5	0.1	647.1	166.0	0.3	-20.4	21.7
19.1	0.1	4920.5	157.0	2.2	-21.0	Inf
19.7	0.1	5916.7	149.0	2.7	-21.7	Inf
20.3	0.1	62.1	139.0	0.0	-22.3	Inf
20.9	0.1	5486.5	126.0	3.0	-22.9	Inf
21.5	0.1	7599.5	111.0	4.7	-23.5	Inf
22.1	0.1	2379.1	101.0	1.6	-24.2	Inf
22.7	0.1	0.0	87.0	0.0	-24.7	Inf
23.3	0.1	9062.0	76.0	8.2	-25.4	Inf
23.9	0.1	5312.8	63.0	5.8	-26.0	Inf
24.5	0.1	2867.8	53.0	3.7	-26.7	Inf
25.1	0.1	4464.3	36.0	8.6	-27.4	Inf
25.7	0.1	7474.6	27.0	19.1	-28.1	Inf
26.3	0.1	0.0	21.0	0.0	-28.8	Inf
26.8	0.1	4321.2	14.0	21.3	-29.4	Inf
27.4	0.1	0.0	8.0	0.0	-30.1	Inf
28.0	0.1	0.0	7.0	0.0	-31.0	Inf
28.6	0.1	0.0	4.0	0.0	-31.6	Inf
29.2	0.1	0.0	1.0	0.0	-32.5	Inf
6- SAM results
Sets the delta value using the precendetely printed thresholds. The up & down regulated observations' statistics are computed based on the chosen delta value.
delta = 16.7;
fprintf ('Gathering SAM results ...\n');

[mat_sig, mat_sig_hdr, called_names, mat_fdr] =...
    sam_results (delta, d, d_bar, vec_false, s, p_value, q_value, fold_out);
Gathering SAM results ...
Determining Delta, prior probability, false called genes, FDR, low and up cut-offs ...
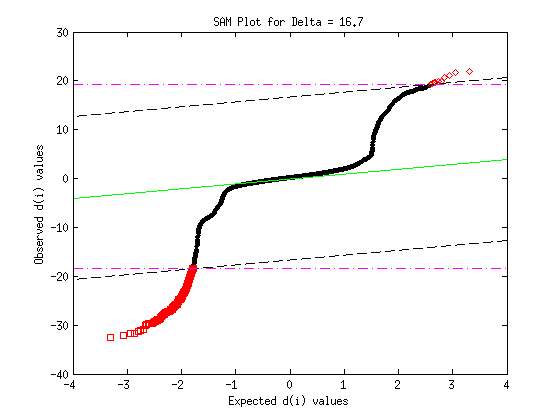
7- Plotting
Plots SAM QxQ plot.
fprintf ('Plotting the SAM results ...\n');
sam_plot (d, d_bar, delta, vec_false);
Plotting the SAM results ...
Determining Delta, prior probability, false called genes, FDR, low and up cut-offs ...
8- Printing
Saves the results on the disk for further analysis purpose.
fprintf ('Printing the SAM results ...\n\n');

fold_status = mkdir ('results');
if fold_status == 1
    file_name = sprintf ('results/golub_results__delta_%.1f.txt', delta);
    save_sam_results (...
        mat_sig, mat_sig_hdr, mat_fdr, called_names, delta, file_name);
else
    fprintf ('Results not saved; check destination folder settings.\n');
end
Printing the SAM results ...

Warning: Directory already exists.
delta : 16.7
s0 : 0.0265144
Number of permutations : 1000
prior probability : 6.904917e-02
low cutoff : -18.4928
up cutoff : 19.3441
Identified genes : 216
Falsely called genes : 1724.12
FDR : 0.551153

The sesults were saved in : results/golub_results__delta_16.7.txt
9- References
- Virginia Goss Tusher, Robert Tibshirani, Gilbert Chu (2001). Significance analysis of microarrays applied to the ionizing radiation response. Proceedings of the National Academy of Sciences of USA, 98(9): 5116–5121.
- Zhu Q, Miecznikowski JC, Halfon MS (2010). Preferred analysis methods for Affymetrix GeneChips. II. An expanded, balanced, wholly-defined spike-in dataset. BMC Bioinformatics, 11:285.